AGRON INFO TECH

Data analysis and visualizations in R program

R is an open-source programming language and graphical environment for statistical computing. For data analysis, visualisation, and modelling, statisticians, data scientists, and researchers frequently utilise it. R offers a large selection of packages that can be downloaded, installed, and loaded to extend the capability of the R language. Several of these packages offer specific tools for data handling, statistical analysis, and visualisation.

These are some essential R programming concepts:

  • Data types: R supports a wide range of data types, including numeric, character, factor, and logical.
  • Data structures: R provides several data structures, such as vectors, matrices, arrays, data frames, and lists, that allow you to organize and manipulate your data in different ways.
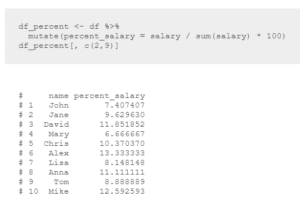
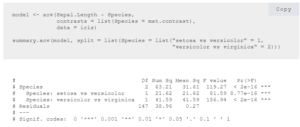
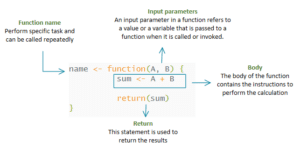
  • Functions: R provides a wide range of built-in functions for statistical analysis, data manipulation, and visualization. You can also create your own custom functions in R.
  • Control structures: R provides control structures such as if-else statements, for loops, and while loops that allow you to control the flow of your code.
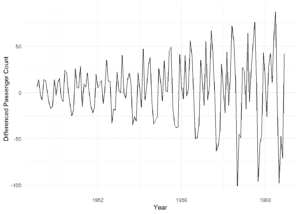
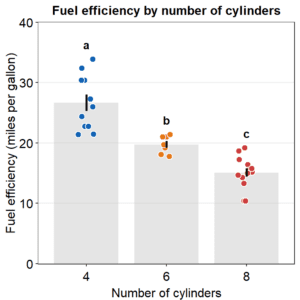
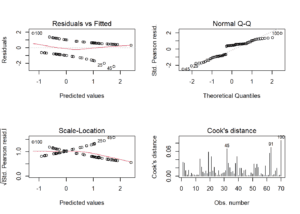
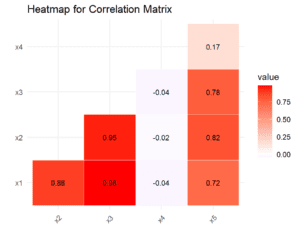
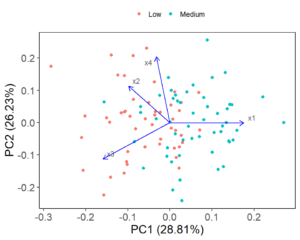
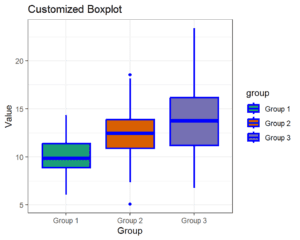
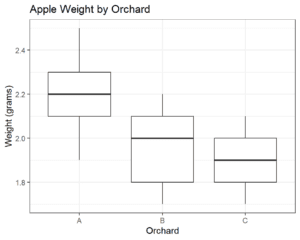
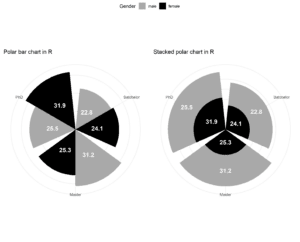
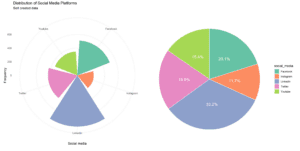
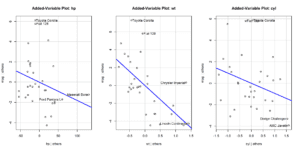
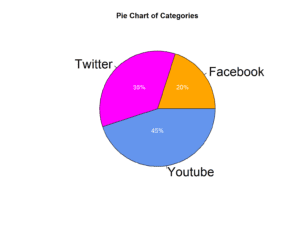
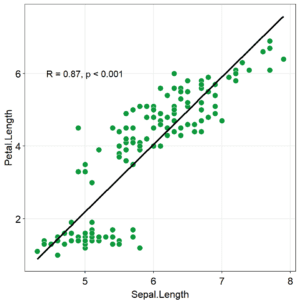
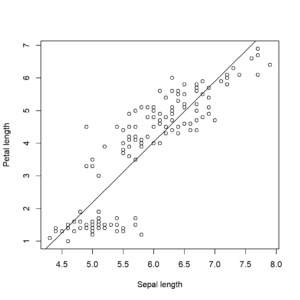
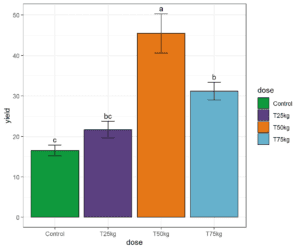
  • Graphics: R provides powerful and flexible tools for creating high-quality graphics, including scatterplots, histograms, bar charts, and more.
Data Analysis and Visualization using R | Your Website Name

Generate publication ready LSD test results with R

Quickly generate multiple bar plots with standard error and lettering in R

Creating hexagon plot in R | hexbin and ggplot2 packages

Time Series Forecasting for Nile River’s Annual Streamflow Data

Elementary Descriptive Methods in Time Series Analysis

Working with date and time objects in R

How to Choose the Perfect ARIMA Function Order for Time Series Analysis in R

Time Series Analysis in R | Forecasting Air Passenger Data

Creating rapid summary table showing mean and standard error using R program

Elegant Fuel Efficiency Bar Plot: Ideal for Research Article Publications

How to perform Structural Equation Modeling (SEM) in R

Generating rapid publication ready ANOVA table in R

Exploring Car Specifications with add_count() Function from dplyr Package

How to Use the cross() Function from dplyr to Manipulate Data in R

Creating and Customizing PCA Biplot using ggplot2 and ggrepel packages

Ordinal Logistic Regression: Predicting Chick Weight Categories from Diet and Time Factors

Building a Logistic Regression Model for Predictive Analysis

Investigating Relationships between Variables with Correlation Analysis in R

Step-by-Step Guide to Perform Principal Component Analysis (PCA) in R

Creating a Simple Boxplot in R Using ggplot2

Master One-Way ANOVA in R: Analyzing Group Differences Made Easy

Best Practices for Data Wrangling in R

Polar Bar Chart and Stacked Polar Charts in R with ggplot2

How to Create a Pie Chart in R using ggplot2 package

Multiple Linear Regression Analysis in R: Simplified for Easy Understanding

Simple Pie Chart in R using the graphics package

Maximizing Your ANOVA Results with Orthogonal Contrast in R

Simplifying Parametric and Non-Parametric Tests for Easy Understanding

Getting Started with Rmarkdown: The Ultimate Tool for Report Writing

Simple way to create scatter plot showing correlation and significance in R

Different ways to compute summary statistics in R

How to Perform Simple Linear Regression in R

A simple way to create a custom function in R

Easy way to create a barplot showing standard error and lettering in R

How to Conduct a Split Plot Analysis in R

Simple way to create Barplot in R using Graphics Package

Two Way analysis of variance in R made easy

One way analysis of variance in R